 Back to selection
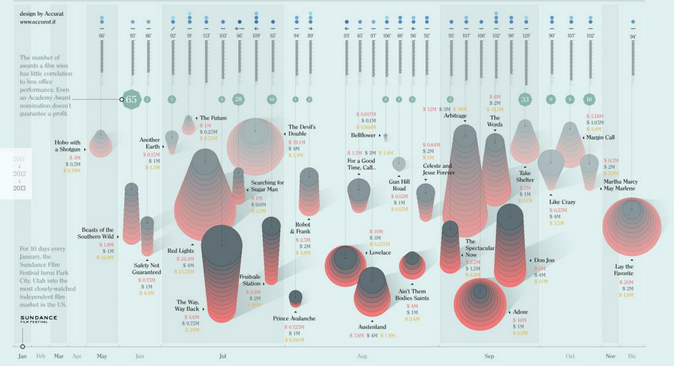
Infographic of Sundance Sales from 2011 to 2013

The Sundance sale. The turning point of the festival for more than just the expected filmmakers and distributors can, at times, be an inscrutable transaction. Is X the best fit for Y? Is X really worth Z amount? Does X’s release in W mean Y’s jockeying for awards season? And so on and so forth.
In honor of the inaugural issue of their magazine, Bright Ideas, Seed&Spark teamed with Accurat to present a data visualization of Sundance sales from 2011 to 2013. The exhaustive infographic demonstrates, above all, that there are no guarantees in translating Sundance buzz to the box office: the proof is in the unpredictable pudding.
Alternately fascinating and head-scratching are the profit margins and losses from various acquisitions. Magnolia picked up Prince Avalanche for $1 million, a price tag several thousands of dollars greater than the film’s budget, and banked not even $200,000 in ticket sales. At the opposite end of the spectrum, Arbitrage was made for $12 million, purchased for $3 million and netted $36 million at the box office.
Also considered are release dates — the most popular of which land between July and September — genre, period setting and awards attention. View the full-sized graphic at the link.
